REGRESSION LINE
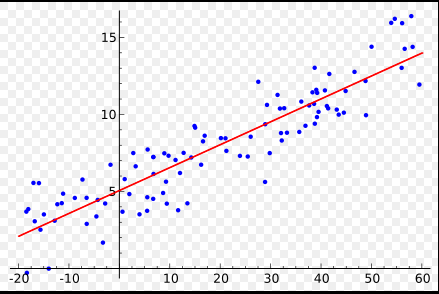
31 May 2017 By PDSNETA regression line is a mathematical construct which is used in technical analysis - and especially in the construction of a time series moving average. A regression line is a line drawn through a set of ordered pairs on a chart such that the gaps between it and the points above the line exactly equal the gaps between it and the points below the line. Consider this example:

Here you can see that a regression is a straight line that passes exactly through the middle of the points on the chart. If you can imagine that those points are rather daily share prices, then you can begin to understand how a time series moving average, which draws a line connecting the end-points of successive regression lines, is constructed.
Share this glossary term: