Market View
J200 108,041.00 +0.46% J203 116,025.00 +0.41% J210 122,402.00 +1.03% J211 130,062.00 -0.97% J212 26,561.00 +1.37% J213 144,729.00 +0.17%
Winning Shares (Top 5)
Code Name Added Price Latest % Gain % Gain/Year
FFB FORTRESSB 2024-06-19 1664 2525 +51.74% +25.94%
ADR ADCORP 2025-05-20 550 635 +15.45% +14.35%
GND GRINDROD 2025-08-23 1446 2689 +85.96% +105.29%
BHG BHP-GROUP 2025-12-06 50350 74959 +48.88% +92.43%
HAR HARMONY 2023-11-16 9920 28987 +192.21% +74.32%
Opinions (Top 5)
Code Name Date Action
SSS STOR-AGE 2026-06-18 View

Storage (SSS) is the JSE's only real estate investment trust (REIT) which specialises in buying and running domestic storage facilities in all major South African cities and in the UK. Its business is split about 60% in South Africa and 40% in the UK. It expects its UK business to exceed the South African business in due course.

The company owns 103 properties worth R17,3bn. The business of Stor-age tends to do well in recession as well as in boom periods of the economy. The average client keeps his storage unit for 2 years. The client base is widely diversified and very stable from a statistical point of view.

The company's foray into the UK demonstrates its ability to find appropriate properties and add them to its portfolio. It also gives the share a rand-hedge element. In its results for the year to 31st March 2026 the company reported revenue up 5,4% and headline earnings per share (HEPS) up 16%.

The company's loan-to-value (LTV) was at 26,7%. The company said, "SA rental income and net property operating income up 10.5% and 11.1% respectively - UK rental income and net property operating income up 1.1% and down 0.8% respectively - Closing occupancy 90.8% (SA 93.4%; UK 81.6%)". We believe that this is one of the best property investments available on the JSE.

It offers a steady growth and minimal risk. Technically the share was rising steadily until April 2022 then it began a downward trend which ended in October 2023. Now moving up again, this share represents a potential buying opportunity in our opinion. On 13th May 2024 the company announced that it had entered into a 3rd party agreement with Hines to manage their self-storage business in the UK.

BIK BRIKOR 2026-06-18 View

Brikor (BIK) is a company that manufactures bricks, roof tiles and clay pipes. It was listed on the Alt-X in August 2007 and describes itself as "...a diverse manufacturer and supplier of building and construction materials across a broad spectrum of the market from low-cost housing, residential to commercial, industrial, civil engineering and infrastructure projects and has a brick and coal segment through its subsidiary, Ilangabi Investments." The company is trying to improve its BEE status.

The share was suspended on the JSE from end of July 2013 to 31st July 2020 at 9c per share. Since it resumed trading, it has shot up to 199c before settling back to 15c. In its results for the year to 28th February 2026 the company reported revenue down 16,6% and a headline loss per share of 1,1c compared with a profit of 0,5c in the previous period.

The company said, "The loss is primarily attributable to the decrease in revenue of R63 million, reflecting adverse market conditions, weaker demand in the Bricks segment and lower coal production volumes during the period". The average value of shares changing hands each day has improved but remains less than R10 000 which makes it impractical for private investors. The patchy revival of the construction sector since 2021 has been a positive factor.

Selling bricks is a tough business in South Africa and this company seems to have survived COVID-19 which speaks volumes for its management, but it remains a thinly-traded and risky penny stock. 

PMR PREMIER 2026-06-18 View

Premier is a food producer which was spun out of Brait (BAT) through an initial public offer (IPO) and separately listed on 24th March 2023 which raised R3,6bn at a share price of 5382c per share. Brait retained 47,1% of Premier. Premier has managed to mitigate the impact of loadshedding on its operations, the costs of which were not a material impact on its financial performance.

In its results for the year to 31st March 2026 the company reported revenue up 6,6% and headline earnings per share (HEPS) up 27,7%. The company said, "Significant deflation in maize input prices, from the previously elevated levels in FY2025, was experienced during the year with the white maize spot price declining 31% since March 2025".

We expect this share to be a blue chip quality operation which is sought after by institutional investors - and hence a solid, if unexciting investment for private investors. We added it to the Winning Shares List (WSL) on 21st August 2024 at 7635c. It has since moved up to 18697c (17-6-26).

We expect it to continue to perform well. On 16th October 2025 the company announced an offer to buy 100% of RFG.

PWR POWER 2026-06-18 View

Powerfleet merged with Mix Telematics (MIX) as a company which specialises in vehicle tracking technology and the Internet of Things (IOT). It has operations in South Africa, Australia, the UK, the US, Brazil, Thailand, and Romania. It is a service company which means it has very low working capital and receives a high proportion of its income as annuity or debit-order income.

This means it is the best kind of company for private investors. It can expand its global footprint virtually without limit and does not have a cumbersome workforce or vast amounts of capital tied up in assets. In its results for the year to 31st March 2026 the company reported revenue up 22% and a headline loss per share of 0,15c compared with a loss of 0,43c in the previous period.

The company said, "Basic and diluted headline loss per share is calculated using net loss which has been determined based on accounting principles generally accepted in the United States of America". On Tuesday 4th April 2024 Powerfleet listed on the main board of the JSE through a secondary inward listing to ensure continuity of trade. On 10th of May 2024 the company announced the change of its year-end to 31st March.

Technically, it has relatively thin volumes with only R32 000 worth of shares changing hands each day on average. This makes it risky for private investors. 

VUN VUNANI 2026-06-15 View

Vunani (VUN) is a black-owned financial services group with interests in asset management, investment, banking, property and stockbroking. It also has an interest in coal mining which has been performing well with the rise in coal prices. In its results for the six months to 31st August 2025 the company reported revenue of R356,6m up from R327,8m and headline earnings per share (HEPS) of 9,5c compared with 6,7c in the previous period.

The company said, "The group generated total comprehensive income for the period of R25.2 million (2024: R22.5 million), while total profit attributable to equity holders of the company amounted to R15.3 million (2024: R10.8 million)." In a trading statement for the year to 28th February 2026 the company estimated that HEPS would be between 10,5c and 11,9c compared with a loss of 2,8c in the previous period.

From a private investor's perspective, the biggest problem with this share is that it is too thinly traded to be a practical investment. 

Winning Share: BHG
Opinion: SSS
The Collapse of Bitcoin  (2026-06-15)

We have never liked Bitcoin or even regarded it as a true investment. As Charlie Munger famously said about those who buy cryptocurrencies, “...somebody else is trading turds and you decide I can't be left out.” More recently, the esteemed Professor Paul Krugman has linked the price of Bitcoin…

We have never liked Bitcoin or even regarded it as a true investment. As Charlie Munger famously said about those who buy cryptocurrencies, “...somebody else is trading turds and you decide I can't be left out.” More recently, the esteemed Professor Paul Krugman has linked the price of Bitcoin directly to the political influence and dominance of Trump. He described its value as nothing but “technobabble”.

We have always advised people not to invest in it and to sell it if they had it. We hope that you took our advice. Our main reason for not considering it to be an investment is that it offers no return. It generates no interest, dividends or rent – meaning it lacks fundamental value. So, its value really only exists in the minds of the people who buy it and as they come to realise their mistake, the price will inevitably decline.

At one point there was the suggestion that cryptocurrencies were somehow digital gold, but nothing could be further from the truth. The truth is that the demand for cryptos is much more similar to the demand for tulips in Holland in the seventeenth century. It exists only in the minds of a relatively few individuals who have been swept away by the rapid advances in technology in the modern world. Cryptos lack universal appeal. By contrast, gold has been known and prized by every human being on earth for millennia no matter what their culture, creed or background.

In any event we will let the chart tell the story.

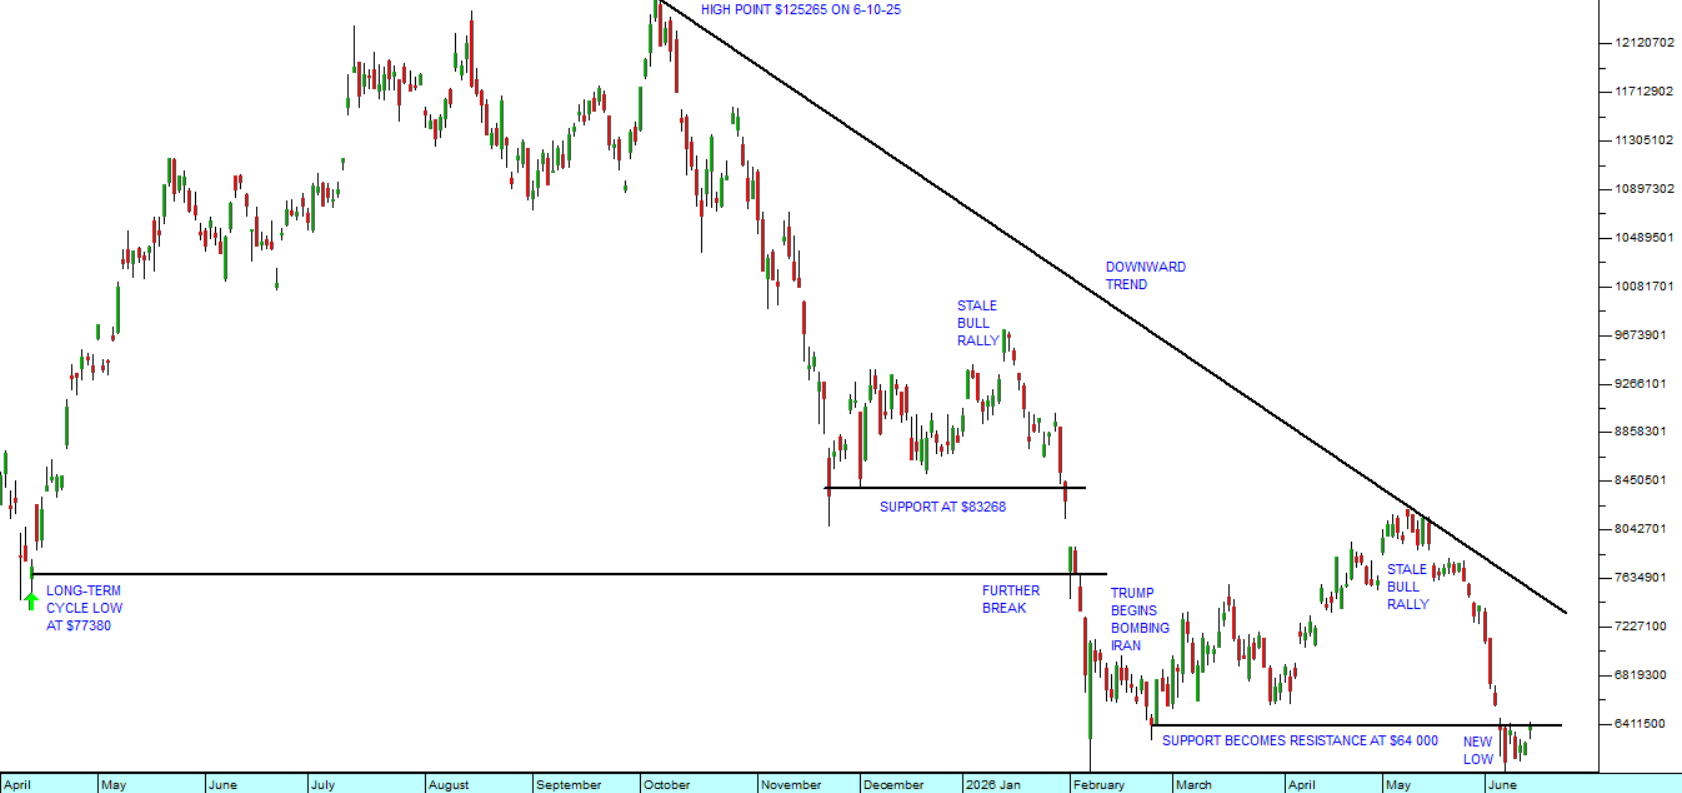
Bitcoin : April 2025 - 12th of June 2026. Chart by ShareFriend Pro.

The collapse of Bitcoin from its peak in October 2025 has been dramatic. Its value has more than halved through a series of cycles. The cycles are caused by the “stale bulls” who simply refuse to acknowledge that Bitcoin’s popularity is now permanently and irreversibly damaged. The Bitcoin price is falling just as Trump’s popularity and political clout are falling.

The effect of Trump’s ill-advised decision to go to war with Iran and the consequent jump in the price of fuel worldwide can be clearly seen. His popularity has nose-dived. Even hardline MAGA supporters who remained loyal through all his other obvious problems found the jump in the price of “gas” just too much to stomach.

From a technical perspective Bitcoin has broken down through a series of key support levels. Firstly, it found support at $83268 – the cycle low of November 2025 and that was followed by quite a significant “stale bull” rally. The rally came to an end when Bitcoin broke below that support level in February 2026 and then smashed down through the earlier cycle low at $77380 established in April 2025.

When Trump began bombing Iran, a new low point was established on 24th February 2026 at $64 000 and again the stale bulls motivated a rally which took the crypto briefly back above $80 000. However, Trump’s continued unpopularity and the growing evidence that he may be suffering from some kind of dementia has resulted in Bitcoin breaking decisively below $64 000 – which has now become a technical resistance level.   

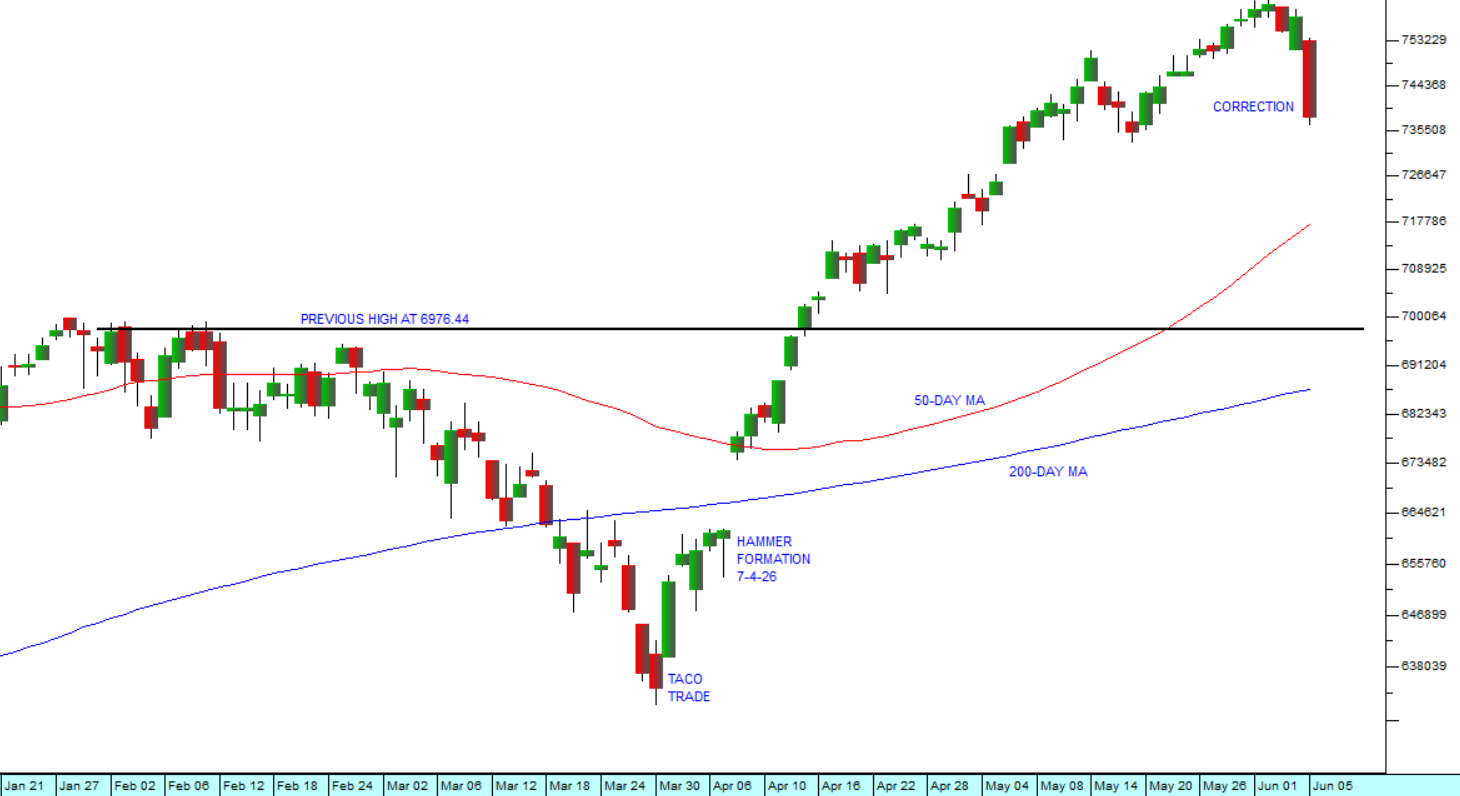
While we see Wall Street recovering from the current correction, we do not see Bitcoin recovering. As Trump inevitably descends into political oblivion, so too will Bitcoin. Already it is an investment sideshow used primarily by organised crime to move money with impunity.  

From our very first article on Bitcoin in December 2017, The Bitcoin Bubble, we have always advised investors to stay away from it. Our advice remains unchanged:

“If you have it, sell it. If you don’t have it, don’t buy it”.

Market Catching its Breath  (2026-06-08)

Experienced investors know that when a market has run hard for a while, as it has for the last two months, some sort of correction is more-or-less inevitable. We suggested in the recent Confidential Report that right now you should be looking for that correction – and then on Friday the 5th of June…

Experienced investors know that when a market has run hard for a while, as it has for the last two months, some sort of correction is more-or-less inevitable. We suggested in the recent Confidential Report that right now you should be looking for that correction – and then on Friday the 5th of June 2026, the S&P500, which was teetering after having made a new record high (7609.78) fell by an impressive 2,64%. Consider the chart:

S&P500 Index : 21st of January 2026 - 5th of June 2026. Chart by ShareFriend Pro.

The anatomy of a correction is that the positive news in the market reaches a point where it has been heavily over-discounted and shares begin to look seriously vulnerable and over-priced. Profit taking then sets in and the market falls back to more reasonable levels. This is a natural and normal pattern - even healthy - which reflects the interaction of the two great human emotions which dominate the market – fear and greed.

The fundamentals of a share can indicate what profits are likely to flow from owning it, while the technicals show the thrust of investor sentiment towards or away from it. When it comes to analysis, there are two kinds of people in the market – those that say they will not buy a share unless they can see the “real” value (the fundamentalists) – and those who say that the real value does not matter. What matters is what people think the real value is (the technicians). In other words, the reality and the perception of that reality.

And markets, like wildfires, can sometimes create their own energy. They can reach a point where they get carried up or down by the mere fact of their own momentum. In the longer term, the positivism or bullishness which is driving this market up today is beginning to become a self-fulfilling prophecy. Some investors are now coming into the market, not because they have done their homework and can see the earning potential of the shares that they want to buy, but rather because they are confident that in a few weeks’ or months’ time, someone with even less knowledge than them will buy the same shares back from them at a higher price.

When this begin to happen, the share’s price tends to lose touch with its underlying fundamentals and become over-priced. The fundamentals may be very good – but the important question is, “Are they good enough to justify the current price?” In 1998, during the dot-com boom, the blue sky potential of the nascent internet boom seemed immense – just as the potential of AI seems immense to us today. But, markets went too far, bid shares up too high, and inevitably fell back to more reasonable levels. However that did not mean that the potential of the internet was suddenly gone – far from it. The internet’s potential was only just beginning to be understood. It was just that markets had become too excited and lost sight of their underlying fundamentals.

We pointed out in our article of 18 May 2026 that the S&P 500 chart is becoming exponential. The blue sky potential of shares is now the dominant factor in investors’ assessments, with the focus shifting to possible future profits rather than established track records. Investors are concentrating on forward, rather than historical, P:E ratios. It is sobering to realise that all three of the enormous new listings coming to Wall Street this year—SpaceX, OpenAI, and Anthropic—are still unprofitable..

In our view, the current correction on Wall Street, and hence on markets around the world including the JSE, is more than likely temporary. After a period of selling, the downward trend will almost certainly give way to bullish investors seeking to buy the dip. Since there is no obvious fundamental factor driving this downward trend we see it as almost completely technical – and therefore temporary and healthy. The market is literally catching its breath.

What is interesting is that the JSE Overall index made its record high on 27th February 2026, at 128456, and has been basically trending down since then. It is apparent that local investors never really believed much in Wall Street’s strong recovery from Trump’s Iran war correction. We have found that often the JSE is a leading indicator of what happens on Wall Street.

Southern Sun Hotels  (2026-05-25)

The Hotel business was probably the worst hit of all sectors during the pandemic in 2020. With the travel restrictions and the various difficulties aimed at preventing the spread of the disease, many business people simply elected to stay at home and conduct meetings on Zoom or Skype. Conventions of…

The Hotel business was probably the worst hit of all sectors during the pandemic in 2020. With the travel restrictions and the various difficulties aimed at preventing the spread of the disease, many business people simply elected to stay at home and conduct meetings on Zoom or Skype. Conventions of various sorts which are major business for hotels also stopped almost completely. Gradually, over the proceeding years the situation has steadily improved, and occupancy rates have climbed back.

From an investor’s viewpoint, the hotel industry offers a very secure and relatively unexciting investment. It has a substantial investment in land and buildings and it has a large staff contingent. In normal times, it can be expected to grow steadily as the economy grows. It remains sensitive to political risk and economic external shocks.

Southern Sun Hotels (SSU) was spun out of Tsogo Sun (TSG) and separately listed on 12th June 2019 – immediately before COVID-19. The share opened at 400c and quickly rose to 460c. It was always expected to be a solid well-traded institutional counter. As the pandemic gained momentum, the share collapsed, eventually reaching an intra-day low of 102c on 23rd March 2020.

At that point it was trading well below its net asset value (NAV), clearly under-priced given its huge property asset base and potential. Slowly, as investors began to realise that the pandemic was past its worst levels and that a vaccine would be produced, they looked around for bargains in the market and SSU was an obvious candidate. Consider the chart:

Southern Sun Hotels (SSU) : January 2020 - 22nd May 2026. Chart by ShareFriend Pro.

You can see here the impact of the pandemic on the newly-listed SSU. At the time we always said that COVID would result in a V-bottom and therefore a buying opportunity precisely because it was a black swan event and its effects would not last. In our article published on 13th March 2020 we said, “...my expectation is that we will see a “V-bottom” in the chart...” SSU (together with many blue chip shares) moved sideways at its worst level for about year and then began to recover.

Then in February 2022, Russia invaded Ukraine and the share price collapsed again – but this time not as badly as during COVID, which was by that time already fully discounted. The subsequent recovery was slow and steady. We finally added the share to the Winning Shares List (WSL) on 17th May 2024 at a price of 555c, but a more adventurous investor might easily have bought it much earlier and at lower levels.

The chart also shows the impact of Trump’s tariffs which initially caused a significant sell-off and, more recently this year, his war with Iran. Both of these events offered private investors further solid buying opportunities, especially for a relatively low-risk share like SSU.

In its results for the year to 31st March 2026 the company reported income up 9% and headline earnings per share (HEPS) up 20%. The company said, "Trading momentum increased in the second half of the year, with broad-based improvements across all regions underpinned by major international conferences and events including the G20 in Gauteng and improved transient demand in South Africa."

Since we added the share to the WSL it has risen 80% in two years. We believe it will continue to perform well as the economic reforms of the government of national unity (GNU) begin to eliminate or at least reduce some of the absurdities in the South African economy. The November municipal elections at the end of this year are likely to increase and consolidate the DA’s grip on the GNU making this effect more pronounced.

JSE Top 40

108,041.00 (+0.46%)

All Share

116,025.00 (+0.41%)

Financial 15

26,561.00 (+1.37%)

J200
J203
J212
Top Gainers
# Code Name Close (c) % move
1 VIS VISUAL 3 +50.00%
2 RNG RANGOLD 140 +16.67%
3 DLT DELPROP 47 +6.82%
Top Losers
# Code Name Close (c) % move
1 MTU MANTENGU 25 -16.67%
2 WEZ WESIZWE 62 -8.82%
3 EMN E-MEDIA-N 192 -7.69%

Top Movers – Charts

Top Gainer: VIS
Top Loser: MTU