OSCILLATOR
19 July 2017 By PDSNETA statistical term which refers to an indicator which moves above and below a set level - usually zero. Many line indicators are oscillators - like the Overbought/Oversold (OB/OS) and the moving average convergence/divergence (MACD). The benefit of an oscillator is that is moves within a defined range which enables you to establish good levels at which to buy and sell. The OB/OS, for example, enables you to establish a "buy line" below which it has always been profitable to buy the share (or other security).
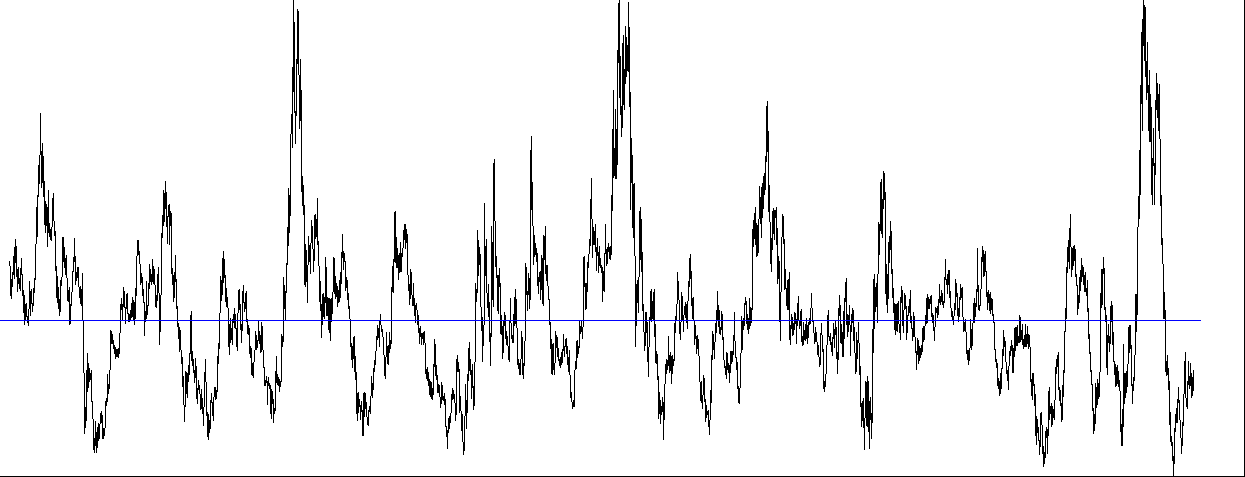
Here you can see an OB/OS of the JSE gold index going back to 1985. The zero line is drawn through the middle. What is immediately obvious is that this index very seldom goes below -35 on this OB/OS and it has only gone above +85 on three occasions in the entire 32 years. So, if you are going to buy gold shares you would do far better waiting until the OB/OS is somewhere near to -35. And you certainly don't want to be buying gold shares when the OB/OS is around +85 because your statistical chance of being right in doing so would be almost zero - but somebody definitely did. That's why the chart goes there.
Share this glossary term: