Choosing Winning Shares
20 November 2017 By PDSNETThe problem which every private investor faces is that there are more than 400 different companies listed on the JSE. How can you choose those shares which are likely to be winners?
The old Wall Street adage goes, “Pick shares which are rising, in sectors which are rising and in markets which are rising”.
Of course, the problem with this idea is that it is likely to cause you to buy shares which already appear to be very fully-priced. The point that you need to get hold of is that shares which are very fully-priced often become even more fully-priced because they are extremely well-managed or have some kind of powerful business edge. A good example of this would be Capitec Bank – which is trading on a P:E which is nearly double that of the other banking shares, but which nonetheless continues to rise – excellent management and a powerful business edge.
And, of course, we are making the assumption that you will always have in place a strict stop-loss strategy, which you will implement as soon as a purchase drops below that key level.
So, let us drill down through this idea to see what we can discover.
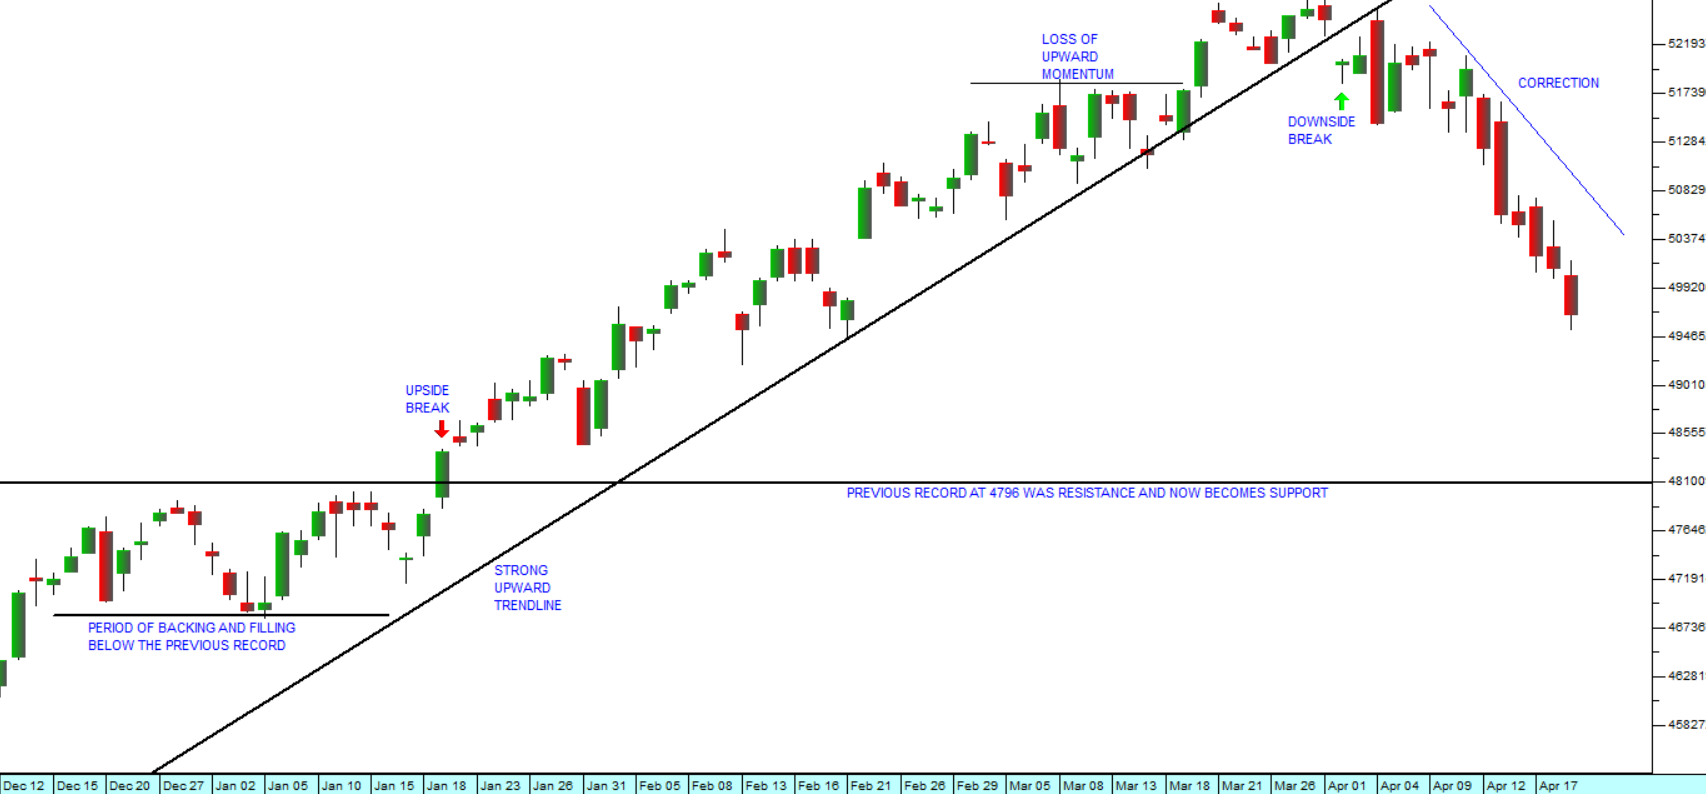
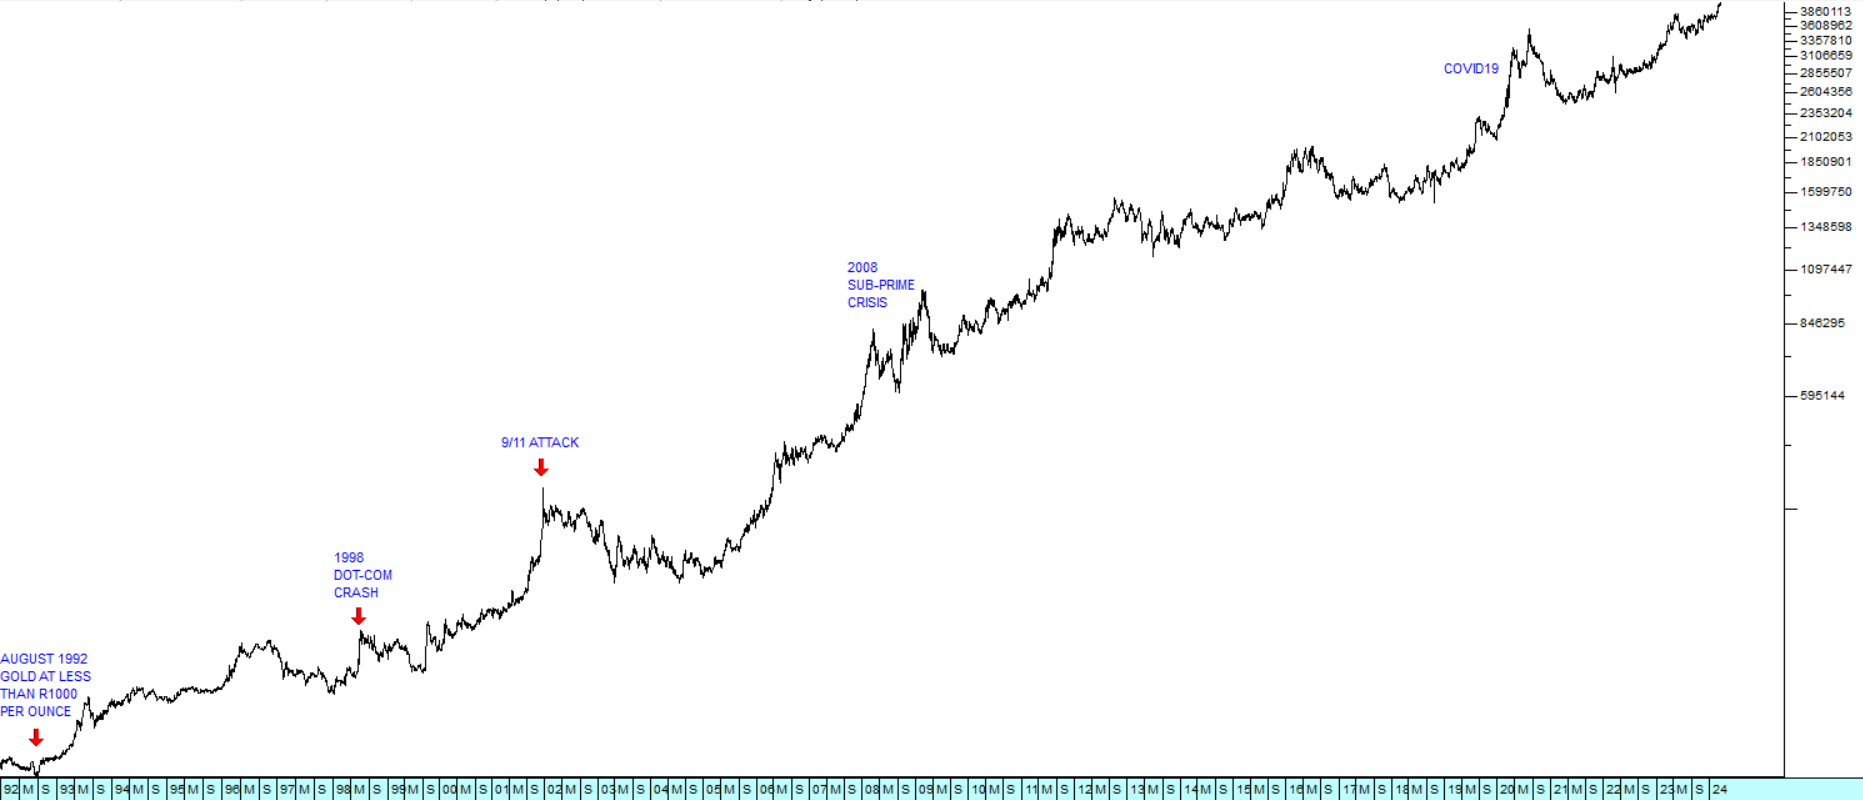
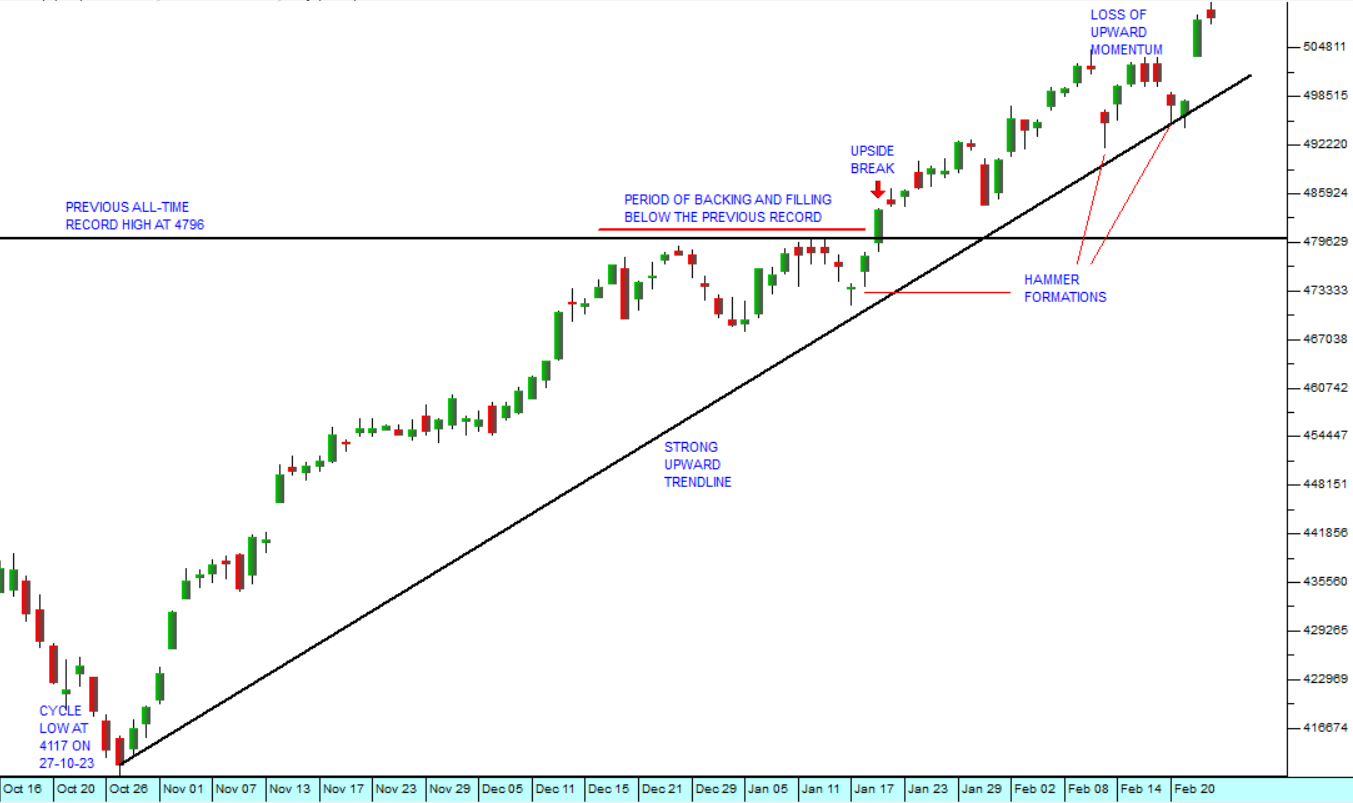
Clearly our market is rising – following Wall Street up, making new record highs, as it anticipates the coming economic boom. This can be seen by considering the JSE overall index:
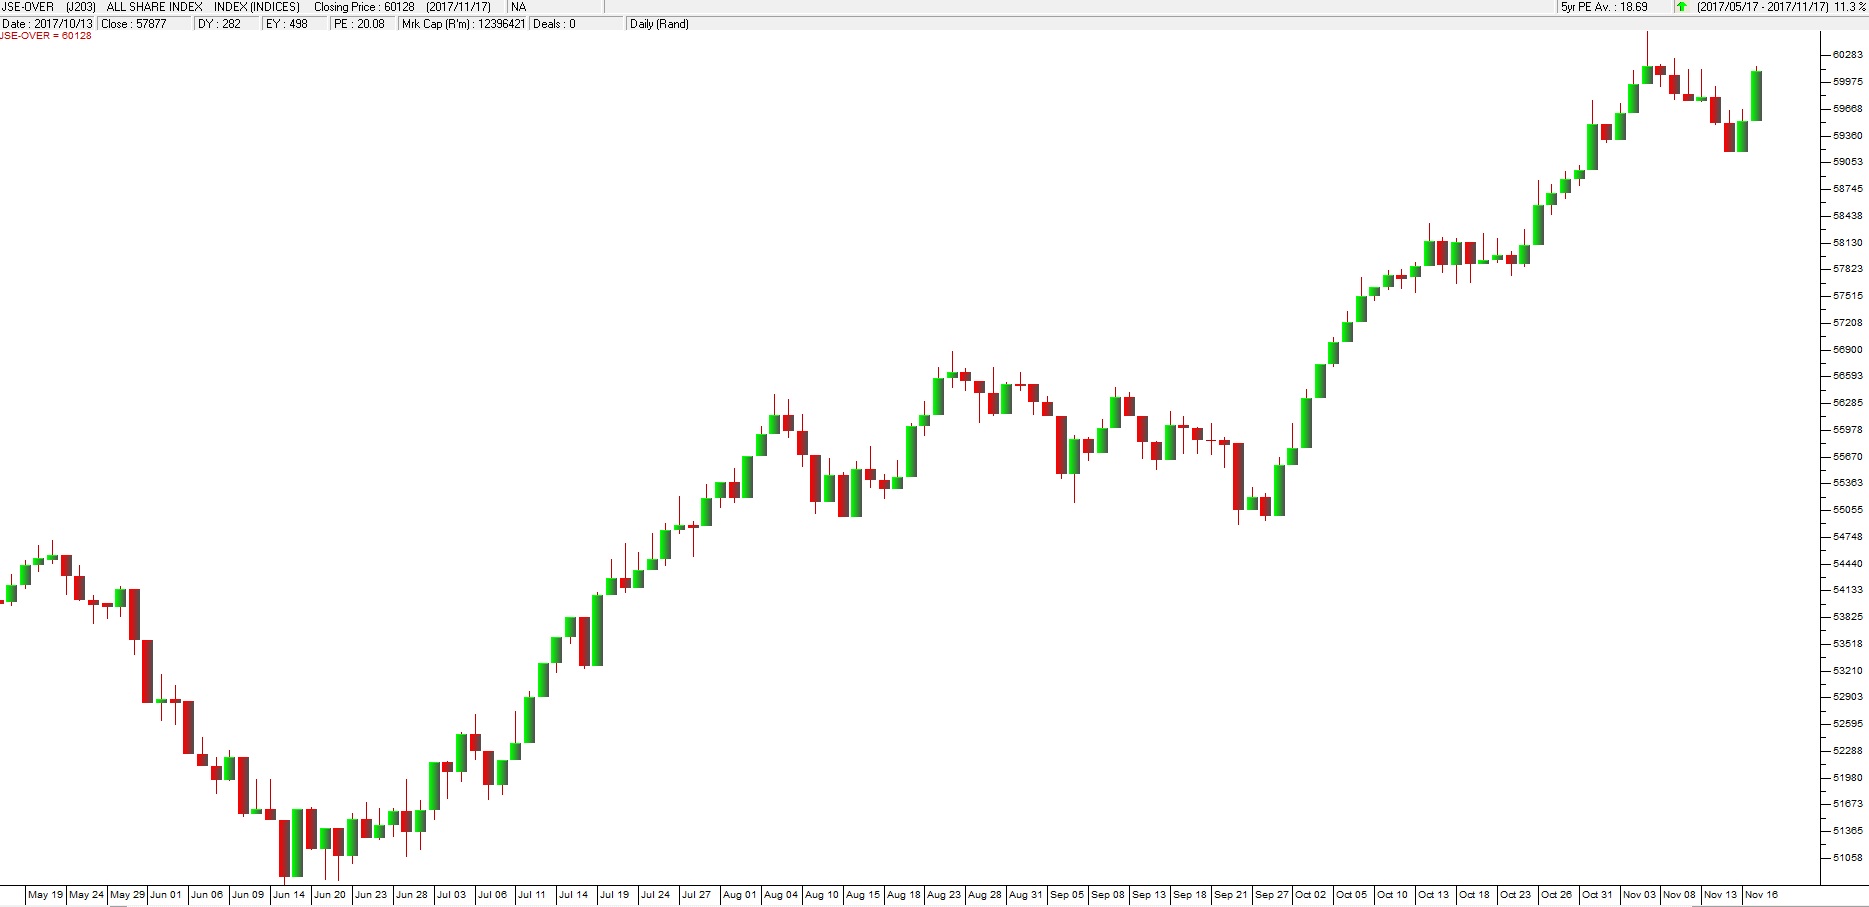
JSE Overall Index - Chart by ShareFriend Pro
But not every sector is rising within that index. To discover which specific sectors are moving, let us consider the “Market Carpets” feature of the ShareFriend Pro software (under “Scans” menu at the top of your software). If we set this unique tool to do a 3-month scan of the sectors we get a diagram like this: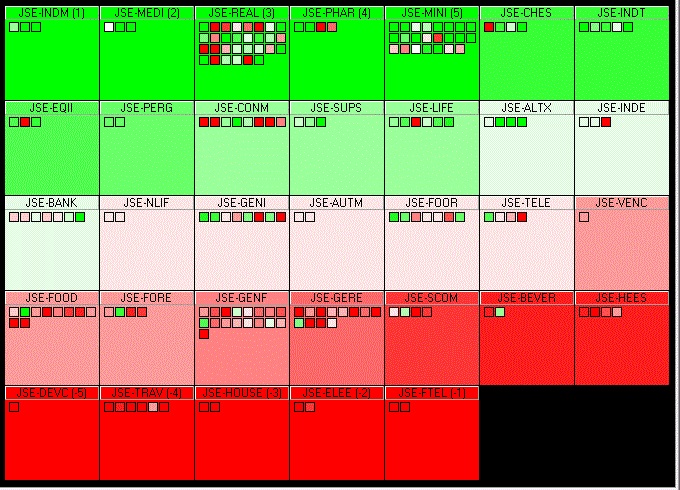
ShareFriend Pro Market Carpets
What this shows us that over the past three months, the best sector has been the Steel and other Metals (JSE-INDM), followed by Media (JSE-MEDI). The worst sector was the Fixed Line Telecommunications sector (JSE-FTEL) followed by the Electronic and Electrical Equipment sector (JSE-ELEE). Now clearly, you will note that the Steel and other Metals index is being driven by the performance of Kumba, while the Media sector is dominated by Naspers (with its 34% stake in the Chinese company, Tencent). So, both of these winners are being pushed by the relative weakness of the rand against hard currencies. But they are also being driven by the strong recovery in the iron price and the exceptional results of social media platform, Tencent, in China. Of these two results, the one that we favour is Naspers simply because it is not being pushed by a commodity – like Kumba. The price of iron could enter a downward trend at any moment (and probably will, considering the rising supply on world markets), while social media usage is likely to continue to expand rapidly in China. Both are well-managed, both are rand-hedges and both could well go higher, but the one appears to us to be less risky. Each sector in the Market Carpet is denoted by a square – and inside that square are small squares which represent the individual companies in that sector. Consider the example of the Construction and Materials index (JSE-CONM):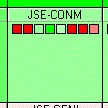
ShareFriend Pro Market Carpets
In this sector, there are 8 items – the index itself and 7 shares. So, the components are from left to right: Aveng, Group 5, the sector index, PPC, WBHO, Raubex, Cons Infra and the Aveng convertible share. The colour of the square indicates how the particular item has performed – i.e. red indicates a heavy loss over the period, pink indicates a slight loss (5% or less), white indicates a neutral performance, light green a slight positive performance and dark green a strong positive performance. So at a glance the market carpets feature enables you to evaluate the entire market sector, by sector and then drill down to the specific shares in each sector. If you place your mouse over the heading of a square it will tell you the name of the index and if you put it over a small square it will give you the name of the share and how much it is up or down in percentage terms. Remember, not all the shares in each sector are included in the index. Smaller companies, suspended shares and inactive shares are excluded.DISCLAIMER
All information and data contained within the PDSnet Articles is for informational purposes only. PDSnet makes no representations as to the accuracy, completeness, suitability, or validity, of any information, and shall not be liable for any errors, omissions, or any losses, injuries, or damages arising from its display or use. Information in the PDSnet Articles are based on the author’s opinion and experience and should not be considered professional financial investment advice. The ideas and strategies should never be used without first assessing your own personal and financial situation, or without consulting a financial professional. Thoughts and opinions will also change from time to time as more information is accumulated. PDSnet reserves the right to delete any comment or opinion for any reason.
Share this article: