Support on the S&P
6 April 2018 By PDSNETWe have always advocated following the progress of Wall Street by watching the S&P500 index because what happens there has a direct impact on the JSE. This has been very apparent over the past two weeks. The S&P500 is in a correction which took it down 10% in just nine trading days between its record high on 26th January and the low of 2581 on 8th February. Consider the chart:
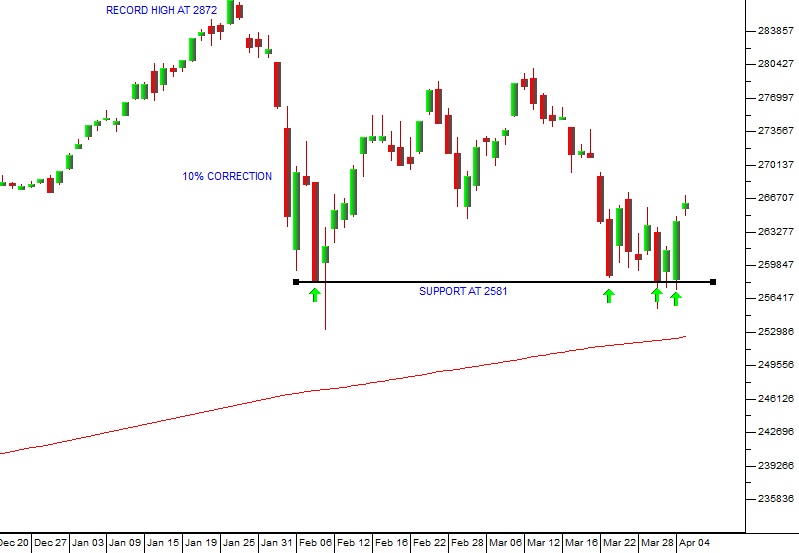
S&P500 Index December 2017 to April 2018 - Chart by ShareFriend Pro
Since then the index has been moving sideways, but on Friday two weeks ago it came down to test support at that low (2581). Then, this week, that low was tested again on Monday and Wednesday (the green arrows). On both occasions, the S&P came back to the 2581 level and bounced. Last night, encouraged by the repeated failure of the bears to get the S&P to close below 2581, the market rallied strongly. So what we now have is a “quadruple bottom” at about 2581 – and that makes it far less likely that that level will be broken. Of course, there are no certainties in the markets, but it now appears reasonably sure that Wall Street will go up to attempt to break above the previous record high made on 26th January 2018. The impact on our blue chips of these repeated attempts of the S&P to break below the support at 2581 was obvious, especially this week when Capitec fell back to R817, making a clear “hammer formation" at that level. This was echoed in the JSE Overall index which also made a “hammer” on Wednesday this week: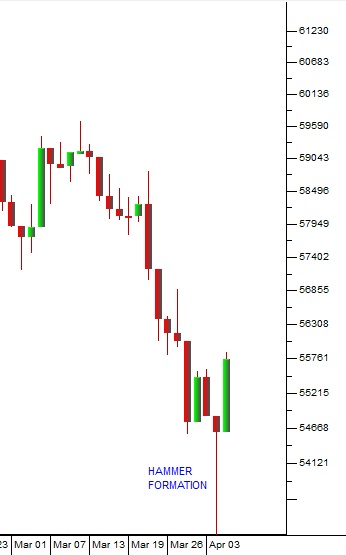
JSE Overall Index - Chart by ShareFriend Pro
The hammer formation is a candle which has a very small body (i.e. between the opening and closing prices) and a very long downward tail (the tail must be at least twice as long as the body). In candlestick charting, a hammer trading day signifies a day on which the bears made a very strong effort to push the share (or index) down to a new low, but failed. It is generally regarded as a bullish signal and as you can see in the chart above, the JSE Overall moved up strongly the next day. In our view, the S&P is now ready to move higher and it will take the markets of the world, including the JSE, with it.DISCLAIMER
All information and data contained within the PDSnet Articles is for informational purposes only. PDSnet makes no representations as to the accuracy, completeness, suitability, or validity, of any information, and shall not be liable for any errors, omissions, or any losses, injuries, or damages arising from its display or use. Information in the PDSnet Articles are based on the author’s opinion and experience and should not be considered professional financial investment advice. The ideas and strategies should never be used without first assessing your own personal and financial situation, or without consulting a financial professional. Thoughts and opinions will also change from time to time as more information is accumulated. PDSnet reserves the right to delete any comment or opinion for any reason.
Share this article:
