The Rand
12 July 2017 By PDSNETThe currency of a country is like the shares of a listed company. If the company is expected to do well and make profits, then its shares will go up and vice versa. The same applies to a currency. If the country is perceived as being well-managed and doing well, then its currency will strengthen against other currencies and vice versa.
The rand is unusual among emerging market currencies because it is the most liquid uncontrolled currency and it trades in a completely free market. This makes it very attractive to international currency speculators and traders. The rand generally trades about R50bn per day. To put this into perspective, South Africa's total reserves of gold and foreign currency are about R47bn. So, the level of the rand against hard currencies is completely outside the control of the SA Reserve Bank. Because our currency attracts many international traders who are constantly researching which way it is going, it is perhaps the best and most accurate barometer of where South Africa is - and where it is headed. These international traders constantly bet billions of dollars on the future direction of the rand and they stand to lose huge amounts if they get it wrong. Of course, money is just a symbol. It is a symbol of the goods and services produced and owned in an economy. The great monetarist economist, Milton Friedman, always said that a country's money supply should not grow by more than the real growth in the economy. Basically, if you allow the money supply to grow faster than GDP growth then you will end up with more money chasing less goods and services which means that the price of everything has to go up. The reality is that many countries allow their money supplies to grow much faster than their GDP growth leading to inflation. Inflation is really a form of taxation. The government prints the money and spends it and the rand in your pocket goes down in purchasing power terms. And it is not a new idea. The Romans invented it. They would periodically call in all the gold coins in the realm on the pretext of stamping them with the new Caesar's image. Everyone had to hand in their coins. The coins were put into a big pot and melted down and 20% of lead was added. The new coins were minted with the new Caesar's face on them and everyone got their coins back which left 20% in the bottom of the pot. They used that to finance the next Punic war. In those days, they called it debasement and today we call it inflation - but it is the same thing. Our esteemed Finance Minister recently said that the country's fiscal targets were in danger which is government jargon meaning: "We are running out of money (and borrowing facilities)". Such statements generally presage a rise in taxes (which we've already had) or an increase in inflation. With these ideas in mind, consider the chart of the rand against the dollar: 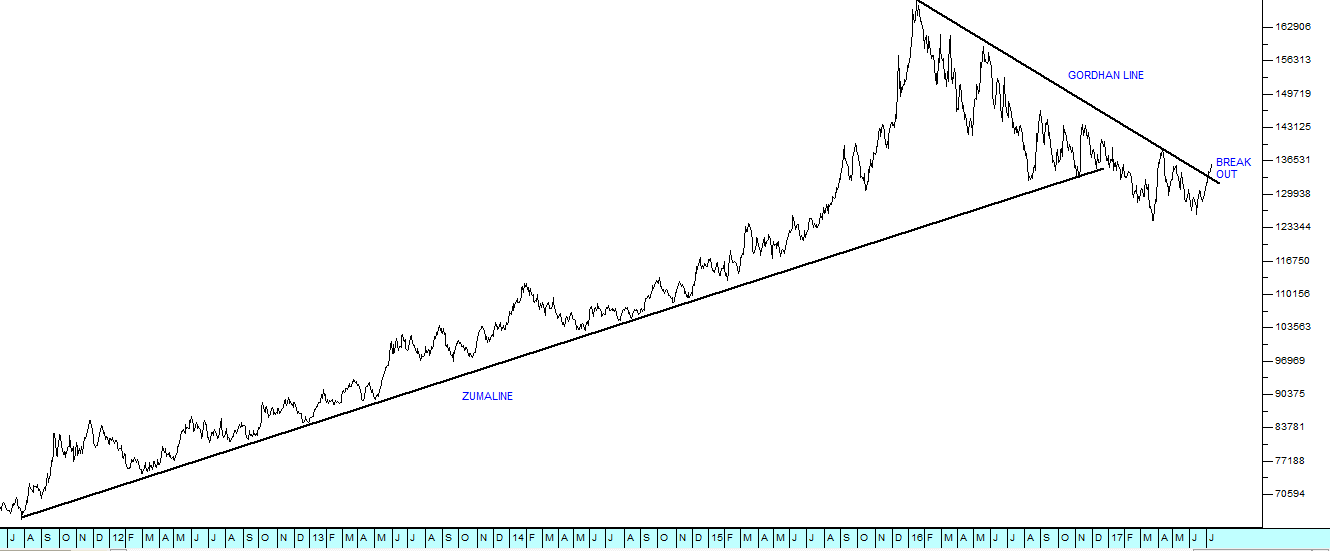
Rand Dollar Chart July 2011 to July 2017 - Chart by ShareFriend Pro
Here you can see the long weakening trendline which we have called the"Zuma line". This ended when Zuma replaced Nene with Gordhan. The "Gordhan line" has persisted until last week, when the various attacks on the independence of the Reserve Bank began to scare those international currency traders. Obviously, the Reserve Bank is all that stands in the way of any sort of retreat into the Robert Mugabe-style printing of money. So, the sudden break through the strengthening "Gordhan Line" in the chart above does not bode well. Perhaps it is time to consider buying some of those rand hedge shares, like Capco which you can buy for just over R50 a share on the JSE and which owns Earls Court and Covent Gardens in London.
DISCLAIMER
All information and data contained within the PDSnet Articles is for informational purposes only. PDSnet makes no representations as to the accuracy, completeness, suitability, or validity, of any information, and shall not be liable for any errors, omissions, or any losses, injuries, or damages arising from its display or use. Information in the PDSnet Articles are based on the author’s opinion and experience and should not be considered professional financial investment advice. The ideas and strategies should never be used without first assessing your own personal and financial situation, or without consulting a financial professional. Thoughts and opinions will also change from time to time as more information is accumulated. PDSnet reserves the right to delete any comment or opinion for any reason.
Share this article:
